
When a patent is challenged in an invalidation proceeding, what happens in the end — is it struck down entirely, trimmed in part, or does it survive? Since China’s Patent Reexamination Board was established in 1987, nearly eighty thousand written decisions have answered this question.
This article analyzes the 79,963 patent invalidation decisions published by the China National Intellectual Property Administration (CNIPA), covering 39 annual cohorts from 1987 through 2025. For each decision, 24 fields — decision number, parties, legal basis, operative holding, panel composition, and more — were extracted automatically from the decision text, with no manual entry and no estimation. This is the longest-spanning full sample of Chinese invalidation decisions available through public channels.
Nearly forty years, 79,963 decisions. But the real story is not “invalidations keep rising” — everyone knows that. The real story is that these numbers contain a conclusion that runs counter to intuition: invention patents, the ones with the highest technical content, are precisely the hardest to strike down — and over the past fifteen years, that advantage has kept widening.
1. Three step-changes in volume: each one maps to an institutional or ecosystem shift
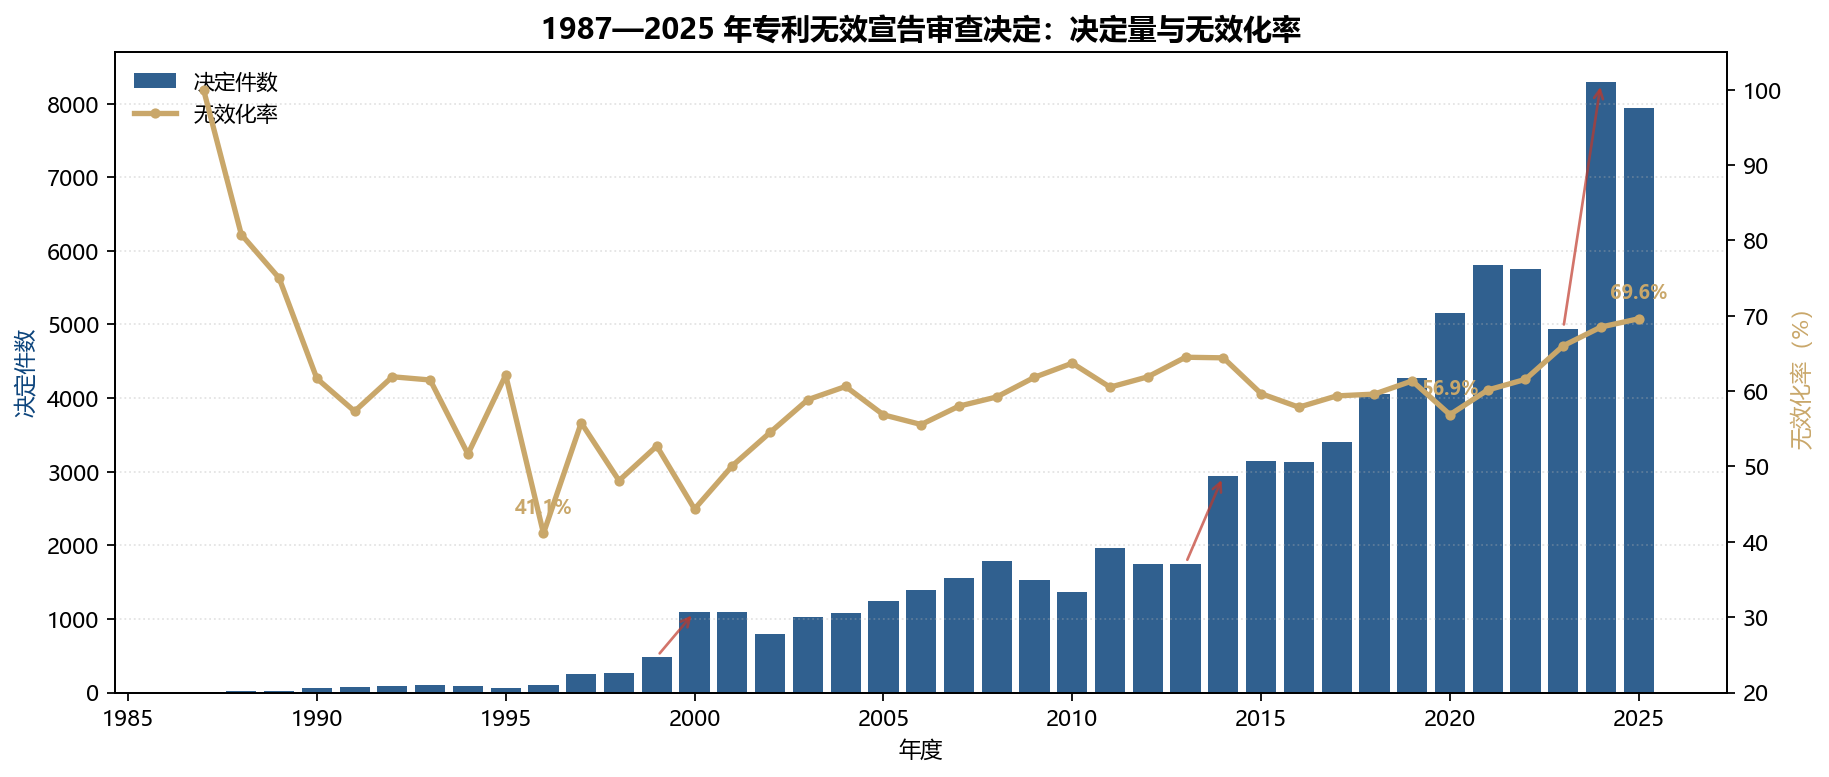
Start with the totals. In 1987 only 1 invalidation decision was published; 486 in 1999; by 2024 and 2025 the figure had reached the 8,000 level (8,288 and 7,942). But this curve did not climb evenly — it was built out of three “step changes”:
| Step change | Year | Prior → current | Growth | What happened at the same time |
|---|---|---|---|---|
| First | 1999 → 2000 | 486 → 1,094 | +125% | Implementation of procedures accompanying the second amendment of the Patent Law; invalidation requests exceeded 1,000 for the first time |
| Second | 2013 → 2014 | 1,748 → 2,944 | +68% | Establishment of the IP courts; demand for enforcement and countermeasures rose together |
| Third | 2023 → 2024 | 4,940 → 8,288 | +68% | Adjusted publication and release cadence; larger annual data packages |
One caveat must be made clear here: the 4,940 decisions recorded for 2023 are not a genuine trough. The official 2023 annual package stops at May 1 of that year, with coverage of roughly 44%, so it cannot be compared directly with adjacent years. Likewise, the 1987–1999 counts are only on the order of tens to hundreds; 2000 is the proper starting point for cross-year comparison.
Another structural change that is easy to overlook: in 2025, design patents surpassed utility models for the first time, becoming the most frequently challenged patent type (3,359 vs. 3,271, or 42.3% vs. 41.2% of that year). The picture in 2018 was quite different — utility models then led designs by 8.4 percentage points.
| Patent type | Share in 2018 | Share in 2025 | Eight-year change |
|---|---|---|---|
| Utility model | 41.6% | 41.2% | -0.4pp |
| Design | 33.2% | 42.3% | +9.1pp |
| Invention | 18.4% | 12.4% | -6.0pp |
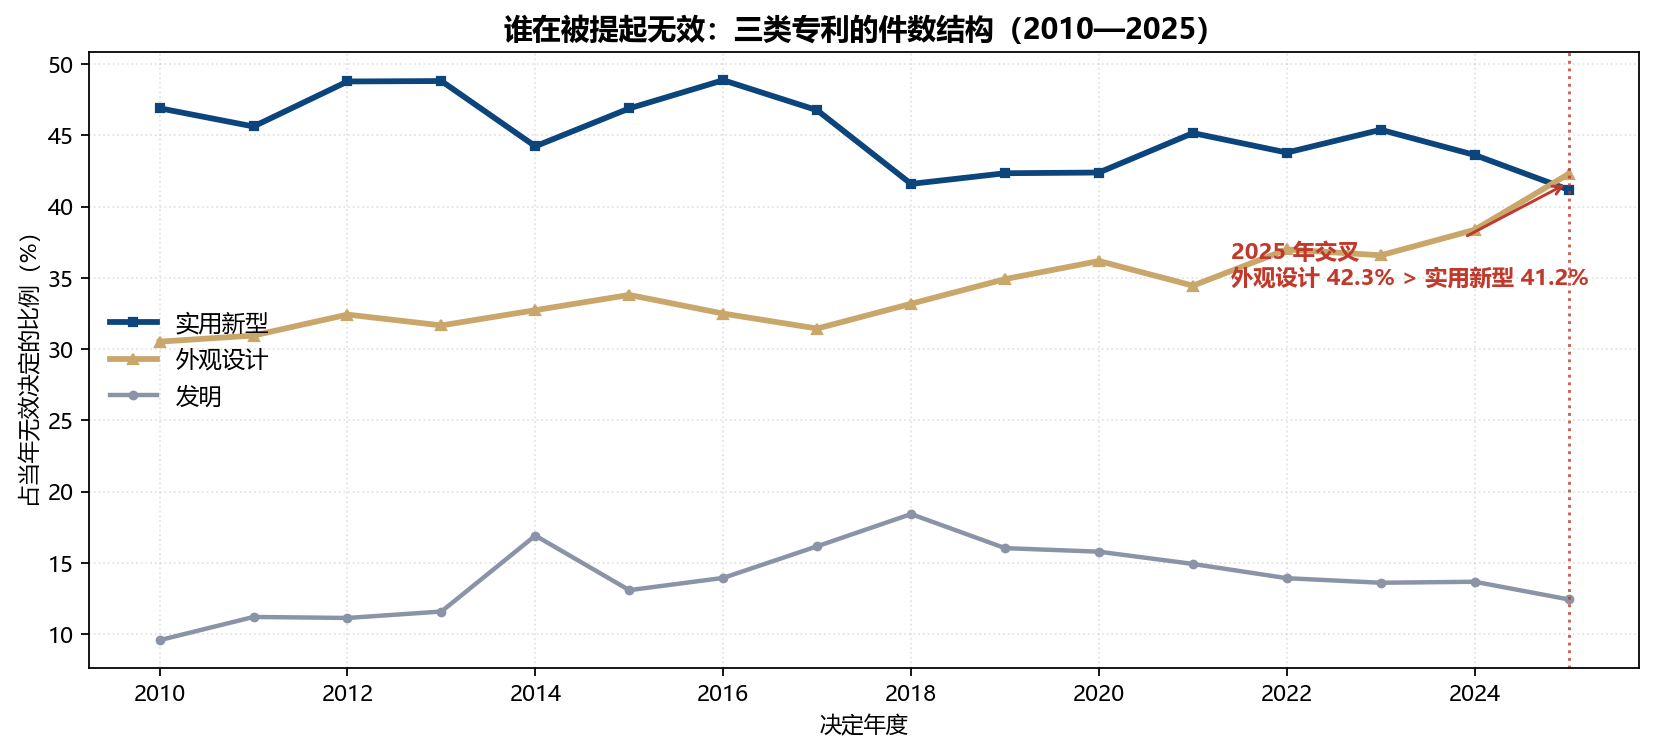
What does this crossover mean in practice? Enforcement conflicts over designs are becoming denser than those over utility models. Design-registration and counterfeiting disputes in e-commerce, trade fairs, and fast-moving consumer goods have become the largest gateway into invalidation proceedings. If designs are the main weapon in your product line, they are also the most likely target of a counterattack.
2. An invalidation rate of 69.60%: a number that is over-read as a whole
The 2025 invalidation rate (full invalidation plus partial invalidation) was 69.60%, the highest in the 39-year database. Over four decades this figure has risen by about 10 percentage points:
| Period | Clear outcomes | Full invalidation | Partial invalidation | Validity maintained | Invalidation rate |
|---|---|---|---|---|---|
| 1987-1999 | 1,638 | 744 | 147 | 747 | 54.40% |
| 2000-2009 | 12,570 | 5,988 | 1,110 | 5,472 | 56.47% |
| 2010-2019 | 27,787 | 14,163 | 2,753 | 10,871 | 60.88% |
| 2020-2025 | 37,899 | 20,614 | 3,826 | 13,459 | 64.49% |
But this number can easily be misread twice. The first misreading is to treat it as evidence that “Chinese patent quality is poor” — it in fact counts only patents that have already entered invalidation proceedings; it is a sample of the “challenged,” not a random sample. The second misreading is subtler: taking 69.60% as the average fate of all patents.
The reality: invention patents challenged in 2025 had an invalidation rate of only 56.38%, 13.22 percentage points below the overall figure for that year. In the same period, utility models stood at 77.01% and designs at 67.25%.
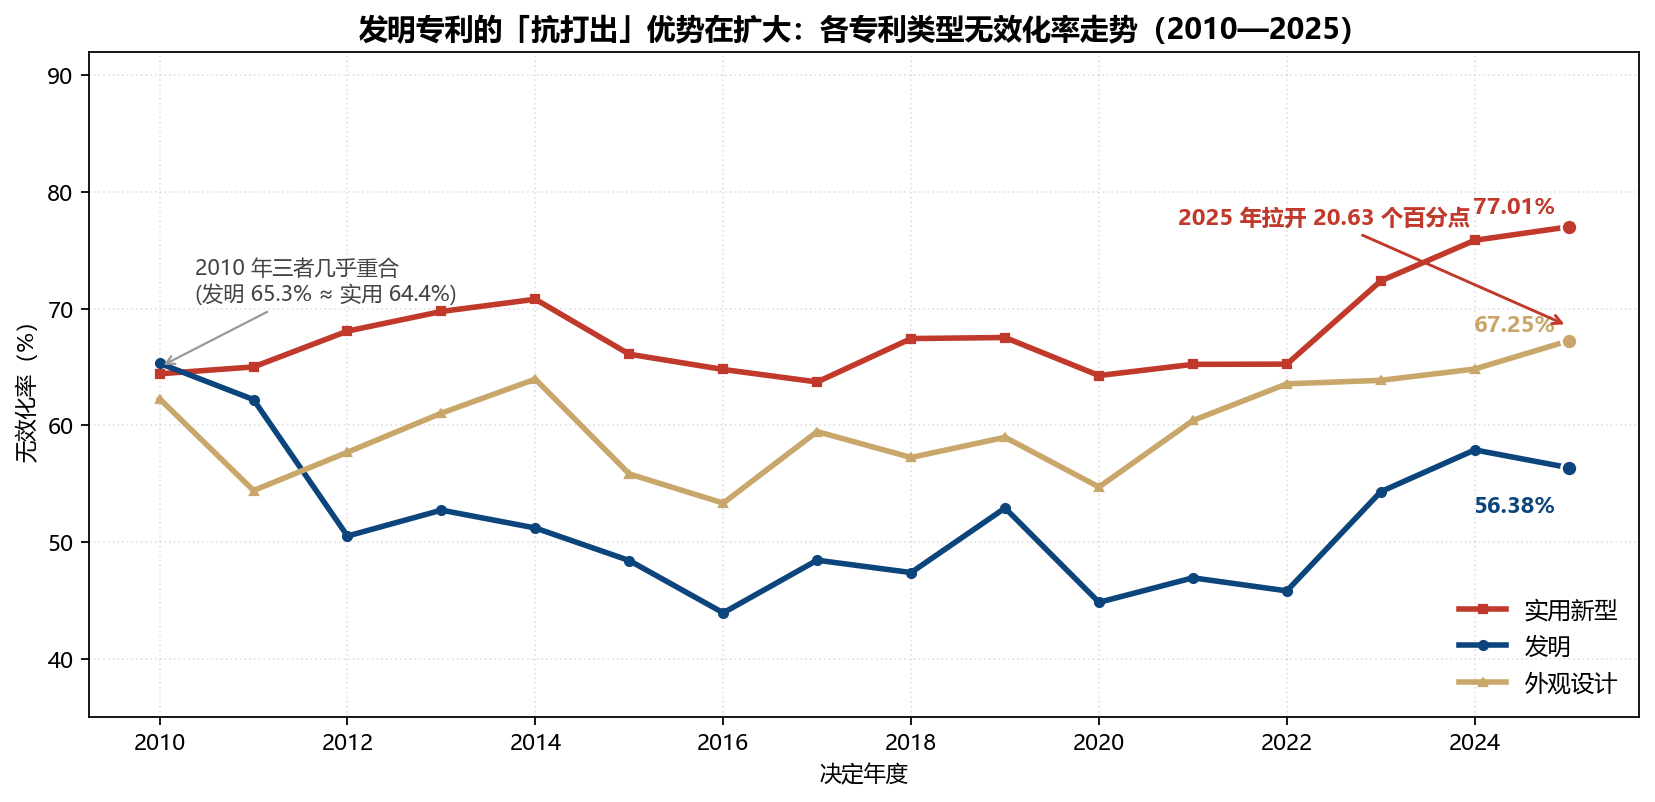
This is the single most noteworthy finding in the dataset. In 2010, the invalidation rates of the three types almost completely overlapped — inventions 65.32%, utility models 64.42%, designs 62.28%, with a maximum gap of less than 3 percentage points. Back then, the answer to “does patent type affect invalidation outcomes?” was “essentially no.”
Fifteen years later, the answer has fully reversed. In 2025: utility models at 77.01%, 20.63 percentage points above inventions; in 2010 the gap was -0.90 percentage points — the two were essentially level.
Why? Three layers of explanation make sense. First, inventions undergo substantive examination: novelty and inventive step have already been compared at grant, so the surviving claims are relatively solid. Second, utility models and designs are not substantively examined — the grant threshold is low, and the actual strength of the claim boundaries has never been tested at grant. Third, petitioners’ target selection is changing: against inventions, petitioners generally need stronger prior-art evidence and screen cases more strictly; against utility models and designs the evidentiary threshold is lower, so success rates are naturally higher.
The practical lesson is direct: do not use “a 70% invalidation rate” to judge the risk of any specific patent you hold. If you own invention patents, the real baseline is about 56%; if you hold utility models, prepare on the basis of a failure probability approaching 80%. The strategic difference between the two is far more valuable than any “average success rate” can offer.
3. Forty years: everything that rose was “full invalidation”; everything that fell was “validity maintained”
The invalidation rate rose from 54.40% to 64.49%. Breaking the three outcomes apart reveals a problem more serious than “success rates are going up”:
| Period | Full-invalidation rate | Partial-invalidation rate | Validity-maintained rate |
|---|---|---|---|
| 1987-1999 | 45.42% | 8.97% | 45.60% |
| 2000-2009 | 47.64% | 8.83% | 43.53% |
| 2010-2019 | 50.97% | 9.91% | 39.12% |
| 2020-2025 | 54.39% | 10.10% | 35.51% |
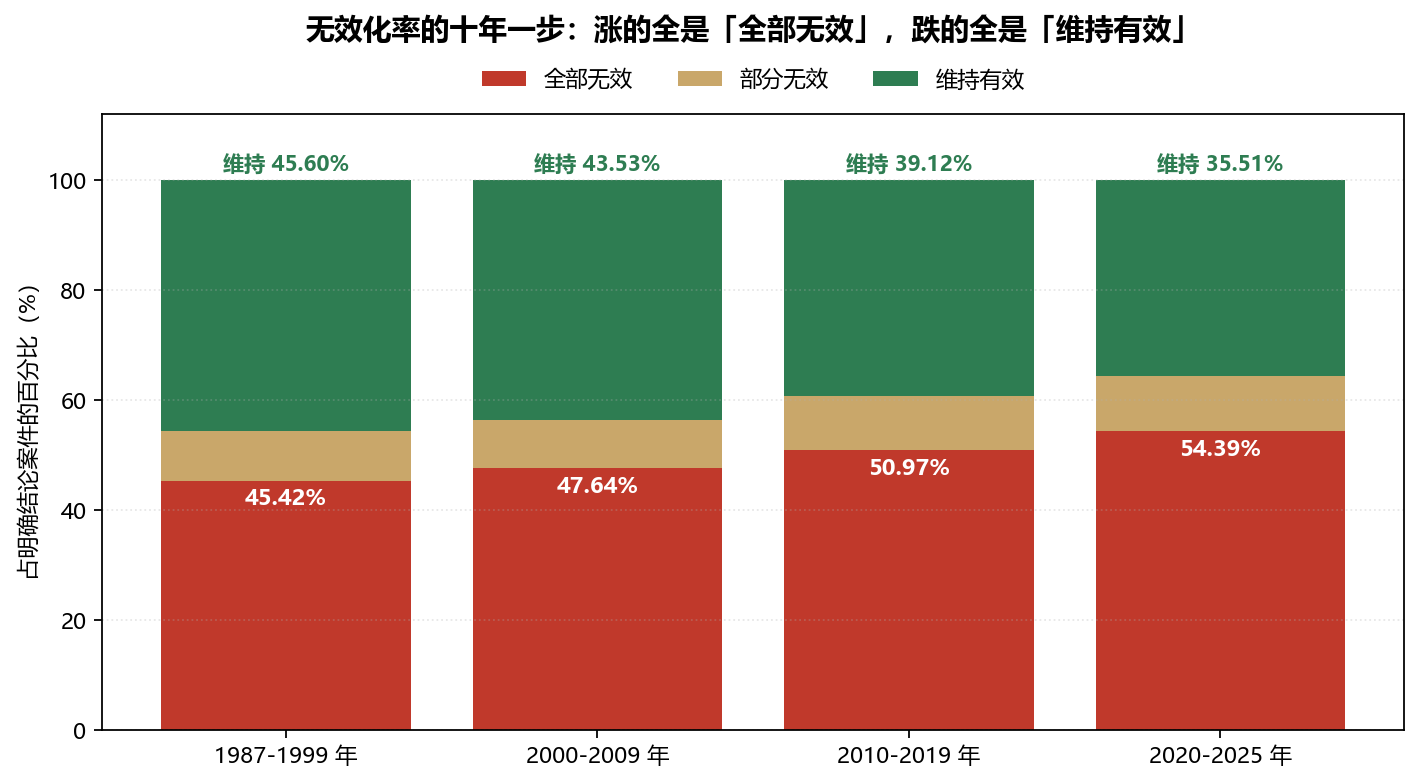
From 1987–1999 to 2020–2025: the full-invalidation rate rose 8.97 percentage points, the partial-invalidation rate rose only 1.13 points, while the validity-maintained rate fell 10.09 points. In other words, the entire four-decade increase in “easier to invalidate” came almost entirely from one outcome — being struck down entirely — not from being trimmed in part.
What patentees should find even more alarming is the most recent period: in 2020–2025 the validity-maintained rate fell to 35.51% — meaning only a little over one third of challenged patents survive unchanged. In 1987–1999 the figure was 45.60%, nearly half.
The enforcement implication is clear: treating “the other side may file an invalidation request” as a low-probability event no longer holds under today’s probability distribution. A stability assessment before sending demand letters, exhibiting, bidding, or suing costs far less than scrambling for fallback options after an invalidation.
4. The trend is not a smooth climb — three data points need individual explanation
Laid out year by year across 39 years, the trend is indeed upward, but at least three years cannot be read at face value:
- 1996 (41.12%), the trough of the whole series. The rate plunged to just over 40% that year, but the number rests on a sample of only 108 decisions, and early-year publication completeness was limited; it should not be cited as the trend’s starting point.
- 2000 (44.35%), a second dip. Volume jumped from 486 to 1,094 (+125%), and the large influx of new cases closed with low success rates, dragging the overall figure down. This was “dilution by volume growth,” not “weakening challenges.”
- 2020 (56.87%), the only dip in the past six years. After 61.35% in 2019 it suddenly dropped, resuming its climb in 2021. Notably, in 2020/2021 CNIPA published both weekly and monthly packages, so the same decision was included twice (deduplication rates 44.87% / 29.56%). Although deduplicated by file name, these two years remain the most unusual stretch of the entire database.
The genuinely clean, directly comparable years are 2023–2025: 66.01% → 68.50% → 69.60%, successively setting new records with consistent data shape across the three years. This is a credible rise, not a statistical artifact.
5. Pendency: 2025 got faster — but don’t celebrate yet
From the date of the invalidation request to the decision date, 63,343 decisions from 2010–2025 carry complete dates in both fields. Across the whole period: median 187 days, mean 218.9 days, P90 294 days.
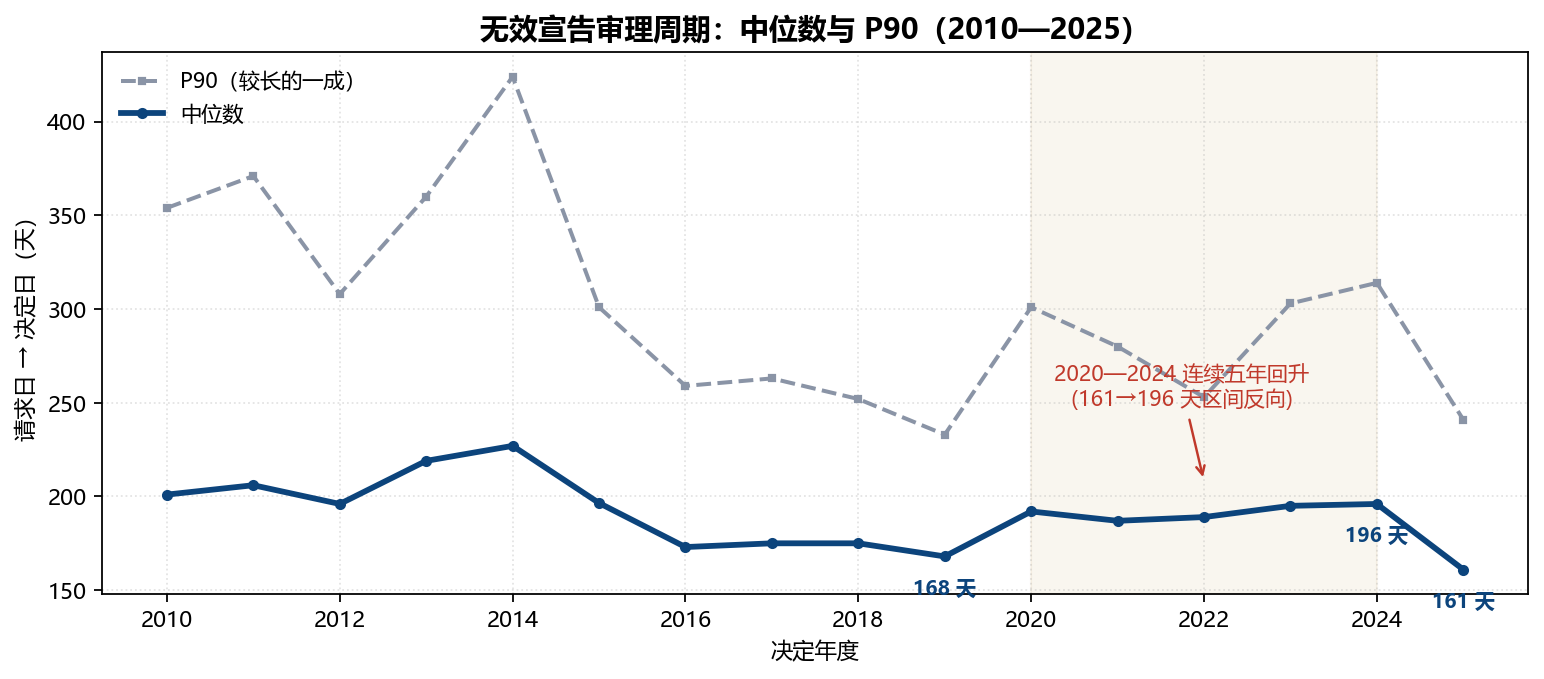
There is a trap here. The 2025 median fell to 161 days — genuinely the lowest in sixteen years; but before that, 2020–2024 had already risen for five consecutive years (192, 187, 189, 195, 196 days). In other words, the “around 170 days” low zone of 2016–2019 is over; whether 2025’s dip is a breakpoint or the start of a new trend will take another year or two of data to settle.
For business planning, medians are not enough: the 2025 P90 is still 241 days, meaning complex cases still require more than eight months of reserve. Anything tied to product launch timing or trade-fair cycles should be scheduled against P90, not the median.
6. Technology fields: machinery is easiest to invalidate, chemistry most resilient — a 15.71-point gap
Split by IPC main class, the top three over the past six years are Section B (Performing Operations; Transport) at 23.78%, Section A (Human Necessities) at 21.12%, and Section H (Electricity) at 16.61% — a pattern broadly matching the industrial structure. What is truly informative is the divergence between share and success rate:
| Technology field (IPC class) | Share of last 6 years | 2016–2025 invalidation rate | Gap vs. baseline |
|---|---|---|---|
| B Performing operations; transport | 23.78% | 64.86% | +0.37pp |
| A Human necessities | 21.12% | 63.64% | -0.85pp |
| H Electricity | 16.61% | 64.69% | +0.20pp |
| F Mechanical engineering | 13.19% | 68.83% | +4.34pp |
| G Physics | 9.05% | 61.93% | -2.56pp |
| E Fixed constructions | 8.15% | 65.50% | +1.01pp |
| C Chemistry; metallurgy | 5.86% | 53.12% | -11.37pp |
| D Textiles; paper | 2.24% | 56.52% | -7.97pp |
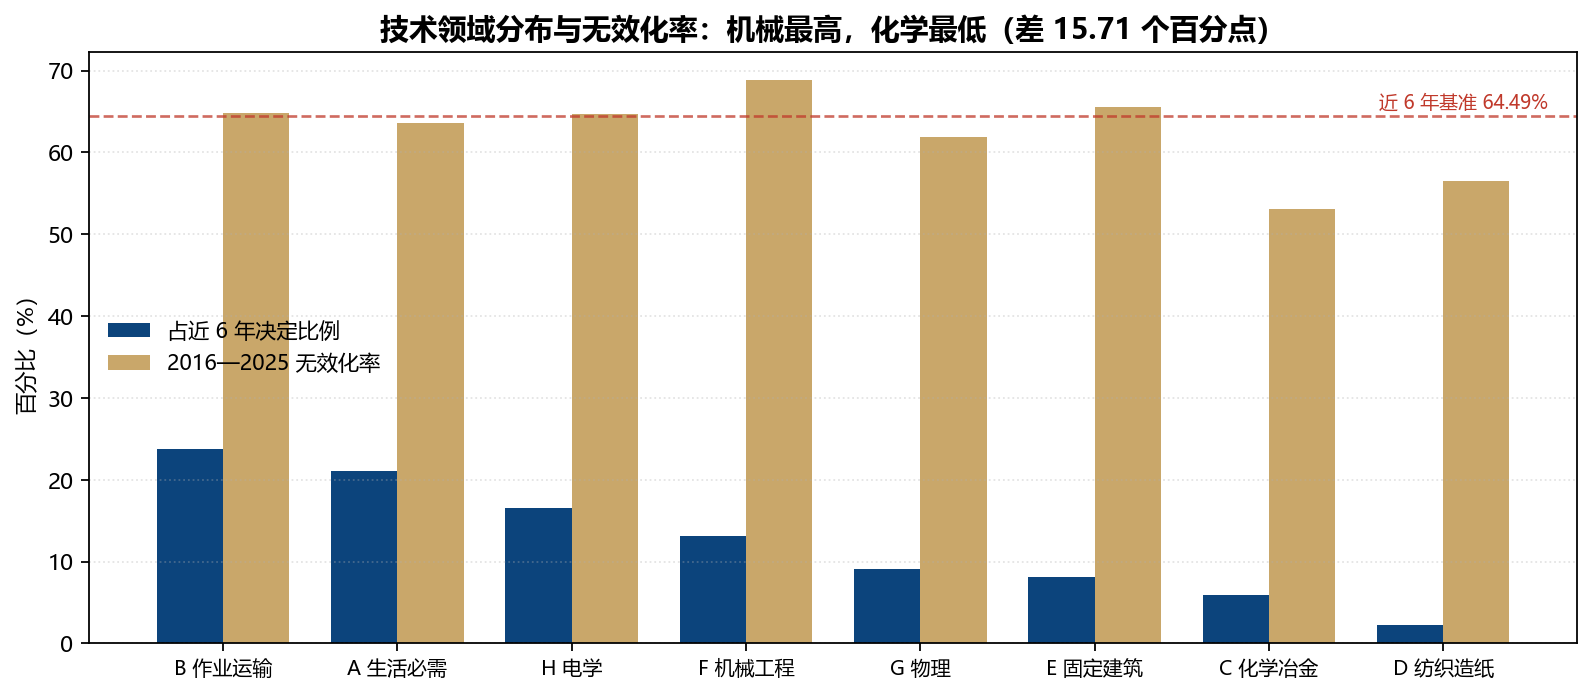
Section F (mechanical engineering, 13.19% share) has an invalidation rate of 68.83%, the highest of the eight major fields; Section C (chemistry; metallurgy, 5.86%) sits at just 53.12%, the only field below 55% — a gap of 15.71 percentage points.
This difference has practical meaning: patents in chemistry and metallurgy are comparatively more resilient in invalidation proceedings. Technical solutions in this field are tightly bound to experimental data, and prior art rarely covers them directly; claims are often limited by parameters or compositional ranges, raising both the evidentiary and comparative bars. By contrast, mechanical-structure patents have highly visualizable technical features, corresponding structures are easy to find in the prior art, and the probability of being found lacking inventive step is therefore higher.
7. Six practical takeaways you can use directly
- Do not read the invalidation rate as an “average.” The overall 2025 rate was 69.60%, but inventions stood at only 56.38%, utility models at 77.01%, and designs at 67.25%. When assessing the risk of a specific patent, first pick the baseline that matches its type.
- The resilience advantage of invention patents is widening — a long-term structural change. In 2010 the three types were almost level; by 2025 inventions trailed utility models by 20.63 percentage points. For patentees, placing core assets in invention patents markedly improves risk resistance.
- Before enforcing utility models or designs, a stability assessment is close to mandatory. Invalidation rates approaching 80% and nearly 70% mean the actual strength of your claim boundaries must be verified in advance — not discovered after the other side files.
- The dominant outcome of being challenged is being struck down entirely. Of the 8.97-point rise in the invalidation rate over four decades, all of it came from the full-invalidation rate. Do not count on “at worst losing part” — intact claims are worth more than a nominally broad scope.
- Designs have become the largest gateway into invalidation proceedings. In 2025 their volume surpassed utility models for the first time (3,359 vs. 3,271). Companies that rely on designs for enforcement should factor this risk into their business plans.
- Schedule against P90, not the median. The 2025 median of 161 days looks fast, but P90 is 241 days. The real time cost of complex cases is still more than 1.5 times the median.
8. Data sources and methodology
- Data source: patent invalidation decisions publicly released by CNIPA through its “IP Data Resource Public Service System.”
- Sample size: 79,963 invalidation decisions covering 39 annual cohorts from 1987 through 2025; the full database was deduplicated by file name.
- Reexamination decisions removed: the raw data contained 161 reexamination-request decisions (using holdings such as “revoke” or “uphold the original decision”); all were removed, along with 82 figure files whose names ended with “figure” (not decision texts).
- High deduplication rates in 2020 and 2021: in those two years CNIPA published weekly and monthly packages in parallel, so the same decision was included once in each granularity — official duplicate publication, with deduplication rates of 44.87% and 29.56%. Deduplication was performed by file name.
- Coverage note for 2023: the official 2023 annual package stops at May 1 of that year (coverage roughly 44%), so its 4,940 decisions cannot be compared directly with adjacent years; this article uses that year for ratio analysis only.
- How the invalidation rate is computed: the denominator includes only decisions with a clear outcome of “full invalidation / partial invalidation / validity maintained,” excluding records with an empty outcome field.
- “Legal basis” = the grounds asserted by the petitioner, not the grounds found by the panel, so a precise “ground success rate” cannot be computed from it.
Frequently Asked Questions
Q: Which is easier to invalidate — an invention patent or a utility model?
A: In 2025 the invalidation rate was 77.01% for utility models versus 56.38% for inventions — a gap of 20.63 percentage points, and it is widening: in 2010 the two were almost level (64.42% vs. 65.32%). The main reason is that inventions undergo substantive examination, so novelty and inventive step have already been compared at grant.
Q: Does the 69.60% invalidation rate mean Chinese patent quality is poor?
A: No. The denominator is patents that have already entered invalidation proceedings, not all granted patents. Challenged patents are usually targets the petitioner has researched and come prepared for — a high-risk sample to begin with. More importantly, this “average” masks a huge spread: inventions face an invalidation rate of only 56.38%, while utility models reach 77.01%.
Q: After a patent is challenged, what is the most likely outcome?
A: Being declared invalid in full. In 2020–2025 the full-invalidation rate was 54.39%, the partial-invalidation rate 10.10%, and the validity-maintained rate 35.51%. Fewer than four in ten challenged patents survive, down about 10 percentage points from 45.60% in 1987–1999.
Q: How long does it take to invalidate a patent?
A: The 2010–2025 median is 187 days (about 6 months); in 2025 it shortened to 161 days. But 2020–2024 saw five consecutive years of increases up to 196 days, so the trend is not yet stable. The slowest tenth of cases (P90) took 241 days in 2025 — complex cases still need more than eight months of reserve.
Q: Which technology fields are easiest to invalidate?
A: Mechanical engineering is highest (68.83%) and chemistry/metallurgy lowest (53.12%) — a 15.71-point gap. In chemistry, technical solutions are tightly bound to experimental data and claims are often limited by parameters and compositional ranges, so the evidentiary and comparative bars are higher, making these patents comparatively more resilient.
Q: Where does the data come from, and can I check it myself?
A: The data comes from the decisions publicly released by CNIPA’s “IP Data Resource Public Service System.” All tables and charts in this article were generated automatically from that official data.
Sources
The data in this article is drawn from patent invalidation decisions publicly released by the China National Intellectual Property Administration through its “IP Data Resource Public Service System,” covering 79,963 decisions from 1987 through 2025. See the accompanying methodology note on this site for statistical details.
For patent annuity and deadline management, use this site’s patent annuity monitoring tool; more guides and tools are available under Zhihai Tools. For a stability assessment of a specific patent or an invalidation defense strategy, contact Hefei Zhihai Yida Patent Agency (firm code 34408).
This is a data-analysis article based on public data, provided for reference only; it does not constitute legal advice on any specific case.